1
2
3
4
5
6
7
8
9
10
11
12
13
14
15
16
17
18
19
20
21
22
23
24
25
26
27
28
29
30
31
32
33
34
35
36
37
38
39
40
41
42
43
44
45
46
47
48
49
50
51
52
53
54
55
56
57
58
59
60
61
62
63
64
65
66
67
68
69
70
71
72
73
74
75
76
77
78
79
80
81
82
83
84
85
86
87
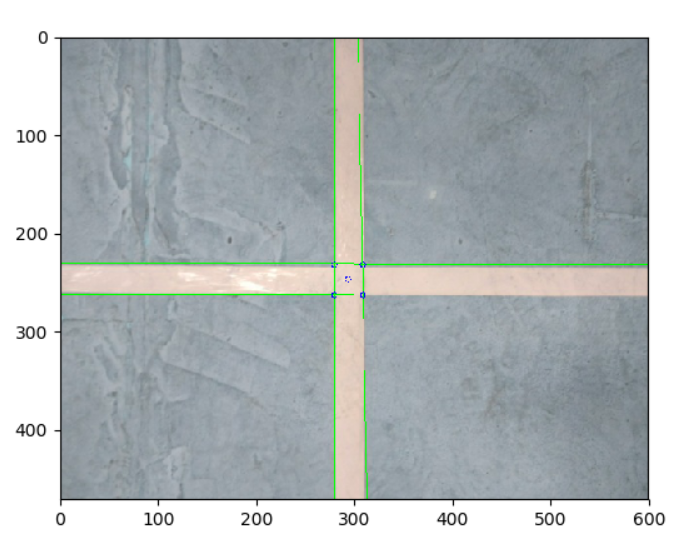
| import cv2
import numpy as np
import matplotlib.pyplot as plt
def cleanlines(lines):
for lineindex, line in enumerate(lines):
if line[0]<0:
lines[lineindex][0] = -line[0]
lines[lineindex][1] = line[1]-np.pi
newlines = []
newlines.append(lines.pop(5))
for line in lines:
flag = 0
for newline in newlines:
if((abs(line[0]-newline[0])<10)&(abs(line[1]-newline[1])<0.1)):
flag = 1
if(flag==0):
newlines.append(line)
return newlines
def IntersectionPoints(lines):
points = []
if(len(lines)==4):
horLine = []
verLine = []
for line in lines:
if((line[1]>(0-0.1))&(line[1]<(0+0.1))):
horLine.append(line)
else:
verLine.append(line)
print(horLine)
for l1 in horLine:
for l2 in verLine:
a = np.array([
                    [np.cos(l1[1]), np.sin(l1[1])],
                    [np.cos(l2[1]), np.sin(l2[1])]
                ])
                b = np.array([l1[0],l2[0]])
                points.append(np.linalg.solve(a, b))
return points
else:
print("the number of lines error")
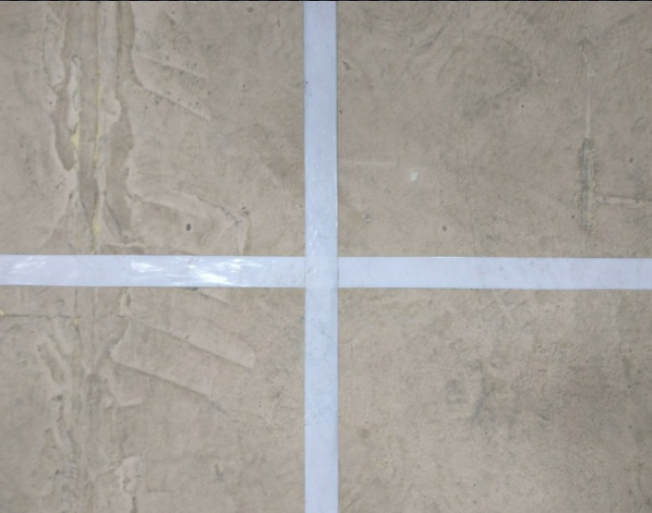
img = cv2.imread('mid.jpg')
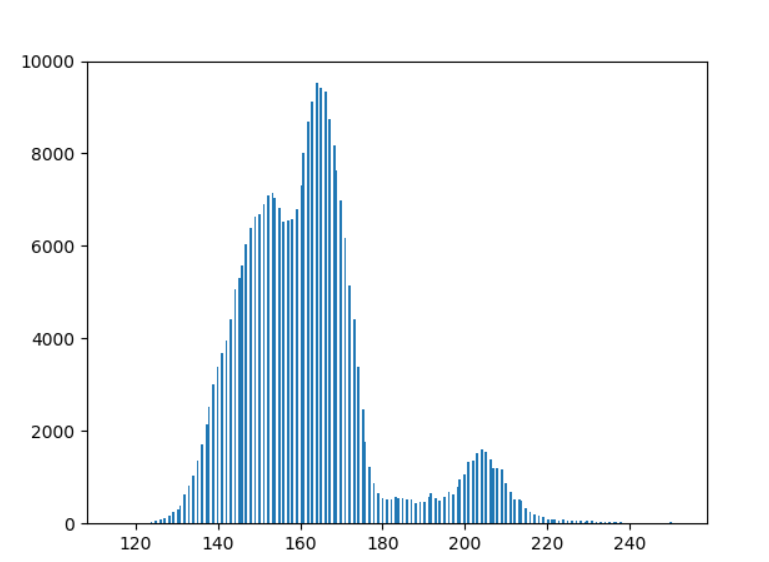
img_gray = cv2.cvtColor(img, cv2.COLOR_BGR2GRAY)
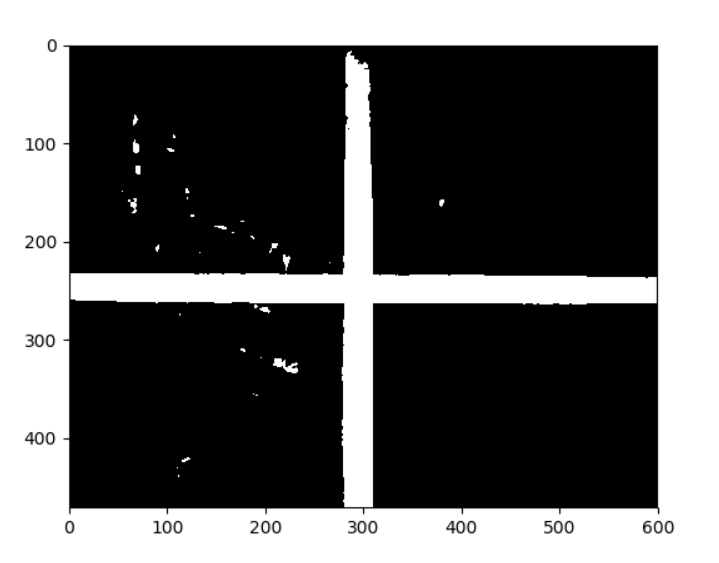
ret, im2 = cv2.threshold(img_gray, 0, 255, cv2.THRESH_BINARY+cv2.THRESH_OTSU)
gimg = cv2.GaussianBlur(img_gray, (5, 5), 0)
gret, gim2 = cv2.threshold(gimg, 0, 255, cv2.THRESH_BINARY+cv2.THRESH_OTSU)
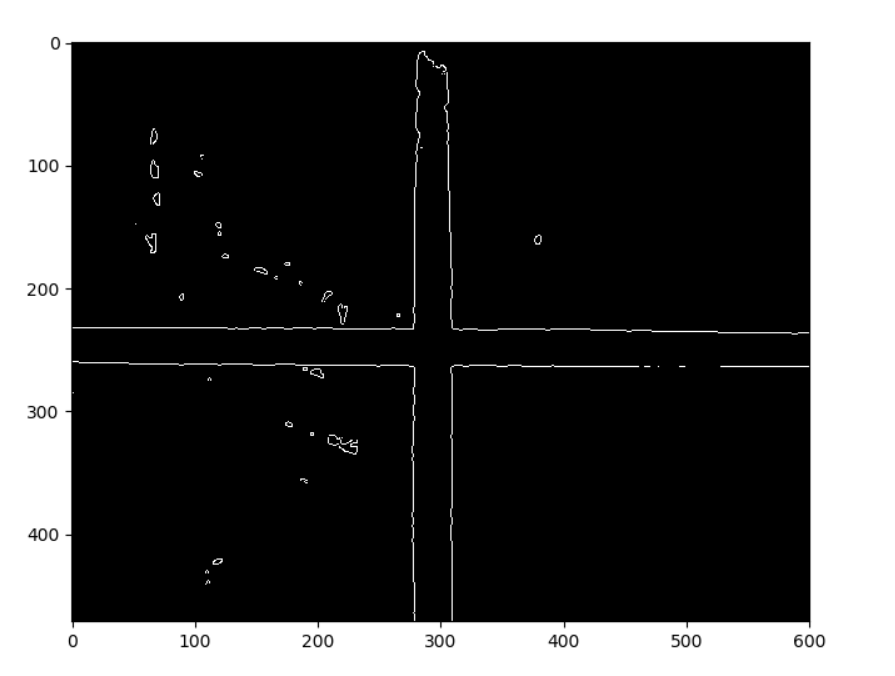
edges = cv2.Canny(gim2, 45,135)
minLineLength = 10
maxLineGap = 5
lines = cv2.HoughLines(edges, 1, np.pi/180, 120)
lines = [line[0] for line in lines.tolist()]
lines = cleanlines(lines)
points = IntersectionPoints(lines)
for line in lines:
rho, theta = line
print(rho, theta)
a = np.cos(theta)
b = np.sin(theta)
x0 = a*rho
y0 = b*rho
x1 = int(x0 + 2000*(-b))
y1 = int(y0 + 2000*(a))
x2 = int(x0 - 2000*(-b))
y2 = int(y0 - 2000*(a))
cv2.line(img,(x1, y1), (x2, y2), (0, 255, 0), 1)
for point in points:
cv2.circle(img, (int(point[0]),int(point[1])), 3, (0,0,255))
midx = np.mean([point[0] for point in points])
midy = np.mean([point[1] for point in points])
cv2.circle(img, (int(midx), int(midy)), 3, (0,0,255))
plt.figure()
plt.imshow(img)
plt.show()
|